Investing · The blog
What to actually do when the market crashes
The short answer
There is a rule on the New York Stock Exchange that exists only for terrible days. If the S&P 500 falls 7% in a single session, trading stops, on purpose, for fifteen minutes. Another halt waits at 13%, and at 20% the market closes for the day, procedures the exchanges built after 1987 and that the Federal Reserve’s own history of that crash describes as giving investors “the ability to make informed choices during periods of high market volatility.” Sit with what that means for a moment. The people who run the market have written down, in advance, exactly what happens when it falls apart. The crash is in the blueprints.
That detail is worth more than every calming platitude in this genre, because it reframes the question. A crash is not the market breaking. It is the market doing something its own operators planned for, something it has done before and will do again, on no schedule anyone can read. Which means “what should I do when the market crashes” has the same answer as any other drill: mostly, the things you decided beforehand, and very little else. This article walks through what crashes have actually looked like in the measured record, what the reacting impulse demonstrably costs, and the short honest list of moves worth making before, during, and after. The stakes are real: the difference between holding a plan through a decline and improvising mid-fall is, by the best available measurement, some of the largest money an ordinary investor ever gains or loses in a single stretch.
What a crash has actually looked like
Start with the record instead of the dread. Here are three modern crashes, each from the organization that measured or chronicled it, because the details are more useful than the blur they get averaged into.
Three crashes, measured
| The episode | What happened | Says who |
|---|---|---|
| Black Monday, October 19, 1987 | The Dow fell 22.6% in one trading session, still the largest one-day decline | Federal Reserve History |
| The 2007 to 2009 crisis | The S&P 500 fell 57% from its October 2007 peak to its March 2009 trough | Federal Reserve History |
| The 2020 pandemic crash | The S&P 500 fell 33.9% in 33 days, and closed above its old peak that August | Federal Reserve (FRED), S&P 500 daily closes |
Black Monday, October 19, 1987
What happenedThe Dow fell 22.6% in one trading session, still the largest one-day decline
Says whoFederal Reserve History
The 2007 to 2009 crisis
What happenedThe S&P 500 fell 57% from its October 2007 peak to its March 2009 trough
Says whoFederal Reserve History
The 2020 pandemic crash
What happenedThe S&P 500 fell 33.9% in 33 days, and closed above its old peak that August
Says whoFederal Reserve (FRED), S&P 500 daily closes
Notice what the table refuses to offer: a pattern. One crash finished in an afternoon. One ground downward for seventeen months. One was over, peak to peak, inside seven months. The Fed’s chronicle adds one more line to the 1987 entry, and it carries the pattern’s other half: by late August the Dow had gained 44% in seven months, a run the historians describe as “stoking concerns of an asset bubble.” Booms and crashes are not separate weather systems. The day that still holds the one-day record arrived at the end of the market’s giddiest stretch in years, which is worth remembering in any future year that feels like a straight line up.
The Federal Reserve’s history of the 2007 to 2009 episode records the full damage plainly: “the S&P 500 index fell 57 percent from its October 2007 peak to its trough in March 2009.” Anyone holding a broad index fund through that stretch watched more than half its value disappear on paper, over a year and a half, with every week’s news insisting the bottom was nowhere in sight. The same essay records what stood around that fall: unemployment climbing from 5% to a 10% peak, home prices down roughly 30% on average, and the net worth of American households shrinking from about $69 trillion to $55 trillion. A crash of that class does not visit the brokerage account alone. That is the severe end of the record, and an honest plan is built to survive it, not the average, which is also why the cash cushion in the last section of this article is not a decoration.
And here is the most recent complete arc, drawn from the Federal Reserve Bank of St. Louis’s daily S&P 500 data, because the shape of a crash teaches something the numbers alone do not.
Anatomy of the 2020 crash
Two things about that shape deserve naming. The fall is fast and the recovery is not announced: the market’s best single day of 2020, a 9.4% rise on March 24, came one trading day after its lowest close, per the same FRED series, deep inside the month when the news was at its darkest, and anyone waiting to feel good before buying back in missed the turn entirely. And the investor who did nothing across those twelve months, whose automatic purchases kept landing on schedule through February’s peak, March’s floor, and August’s recovery, ended the year ahead without making one correct prediction. Every buy below the old peak simply purchased more shares for the same dollars, and earning that required nothing except not stopping.
The expensive move is the one that feels responsible
Selling into a fall does not feel like panic from the inside. It feels like taking control, protecting what is left, being the adult in the room. So it is worth knowing what the behavior actually costs when it is measured across millions of real accounts, not argued about in the abstract.
Morningstar runs that measurement annually. Its Mind the Gap study compares the returns funds delivered with the returns fund investors actually collected, and the gap between the two is the price of timing: money moving in after gains and out after losses. The 2025 edition found the average dollar in U.S. mutual funds and ETFs earned 7.0% a year over the ten years ended December 31, 2024, against the funds’ own 8.2%: a gap of 1.2 percentage points every year, surrendered not to fees or to bad funds but to the timing of investors’ own purchases and sales. The study’s subtitle states its finding in eight words: “The more investors traded, the less they made.” How much of that gap is really timing is contested: a 2026 Financial Analysts Journal paper by Fulkerson, Jordan, Riley and Yan reworks Morningstar’s own sample and finds that poor timing costs investors 0.10 percentage points a year, not the full 1.2.
Inside the study, the pattern sharpens in a way that flatters nobody’s excitement. Investors in plain allocation funds, the boring all-in-one kind built to be left alone, collected nearly 97% of their funds’ returns over the decade: almost no gap at all. Investors in narrow sector funds, the thrilling kind that get bought right after a hot year, gave up 1.5 percentage points a year, the widest equity shortfall in the study’s table. The instrument least worth reacting to produced the least reacting, and its owners kept the most of what their funds earned. Boring is not a compromise in a crash. Boring is the feature.
Read that against the chart above. The gap is not built in ordinary months; nobody abandons a plan in an ordinary month. It is built in exactly the stretch between a February peak and a March floor, when selling feels like safety, and in the recovery that follows, when the money that fled waits for permission to return and the permission arrives only after the prices have. A crash is the gap’s harvest season. The market’s declines take value away temporarily; the exits taken during them make it permanent. That is the entire mechanism, and it is why the most valuable thing most investors can do in a crash is refuse to supply their account to it.
The short list that actually helps
None of which means a crash demands nothing of you. The honest to-do list is short, boring, and real, so here it is.
Let the automation keep running. The scheduled buys you set up in calm weather are the plan working, not the plan needing review; each one purchases more shares than it did at the peak, which is the only version of buying the dip that requires no forecast. Check the cushion, not the portfolio: the useful account to look at in a crash is the savings account, because the cushion is what guarantees no surprise bill can force a sale at the bottom; where that cushion sits in the full order of your money has its own complete answer on this site. If your plan includes a target mix of stocks and safer holdings, a crash is when rebalancing back to it quietly buys low, on the plan’s authority rather than your nerve. And log out. The balance will be lower tomorrow or it will not, and nothing about your plan changes either way; the SEC’s investor education office, in a piece written for exactly these weeks, opens with the only instruction that matters in the moment: “Your first reaction during a time of market volatility may be to panic. Don’t.”
What does not belong on the list: redirecting money with a near date into stocks because they look cheap, borrowing to buy the dip, or reshaping a long-term portfolio around this week’s headlines. Cheap can get cheaper, and the record above includes a decline that did not stop until more than half the market’s value was gone. The dip is bought with money that was already on its way in, never with money that has somewhere else to be.
One move on the internet’s crash lists deserves an honest sentence rather than a bullet: tax-loss harvesting, which means selling a losing position in a taxable account to record the loss against your taxes, while moving into something similar but not identical so you stay invested. It is real and it can be worth doing, but it is a taxable-account tool for people with meaningful balances there. Inside a Roth IRA or a 401(k) there is nothing to harvest, because nothing in those accounts is taxed to begin with, and for the beginner whose investing lives in a retirement account, this whole item can be skipped without loss. Where it does apply, the IRS’s wash sale rules in Publication 550 govern the not-identical part, and getting them wrong undoes the benefit, which is why this move belongs to deliberate afternoons and never to panicked mornings.
Before the next one
The strange comfort of this subject is that everything protective happens in advance, and all of it is ordinary. The former director of the SEC’s investor education office, Lori Schock, compressed the whole preparation into one sentence of guidance: “One of the best ways to manage the impact of market volatility on your portfolio … is to create and stick with a risk-appropriate, diversified investment plan.” Unpack that and it is three checks you can run this week, no forecast required. Diversified: your investments are broad, the whole market rather than a handful of names, so no single company’s disaster is your disaster. Risk-appropriate: nothing you need within the next few years is standing in the stock market’s weather; dated money lives in savings, which is what lets the invested money fall without consequence. And a plan you can stick with: automatic contributions that continue regardless of headlines, so that no future decline ever arrives as a decision you have to make well under pressure.
Do those three hold for you now? Then the next crash, whenever it arrives, is already handled, and the day it comes your job will be the strangest one in finance: to be the person the circuit breakers were not built for, the one who checked the cushion, left the automation running, and went outside. The exchanges plan for panic because there will always be enough of it to require a fifteen-minute pause. Nothing requires it of you. The same sentence from Schock’s office closes the loop better than I can, so I will leave you with it: “Remember, ultimately, it’s time in the market, not timing of the market, that generally leads to long-term investing success.”
Keep going, free
The Beginner Investor's BlueprintFree
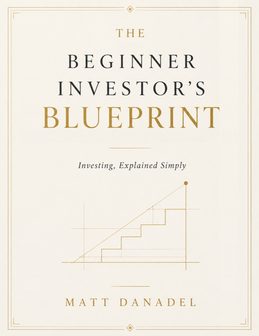
This article is the crash chapter. The Beginner Investor's Blueprint is the whole plan it belongs to: the order for every dollar, the accounts and the one fund to hold in them, the automation that does the staying-calm for you, and a first $100 actually invested by its final page. It costs nothing, and it was written so that a falling market finds you already prepared.
Questions, answered straight
Should I sell my investments before a crash?
Selling ahead of a crash requires knowing the crash's date, and nobody demonstrates that ability reliably. Miss the guess and you pay taxes, lose your position, and face the harder second decision of when to get back in. The SEC's investor education office puts the working principle plainly: it is time in the market, not timing the market. A plan you can hold through a decline beats a prediction every time.
How long do stock market crashes last?
There is no schedule, and the honest range is wide. The 2020 crash took the S&P 500 down 33.9% in 33 days and prices closed back above the old peak within five months, per Federal Reserve data. The 2007 to 2009 fall ran seventeen months, cut the index 57%, and took years to fully retrace. A plan has to be able to survive the long kind, not just the sharp kind.
Is a crash a good time to buy stocks?
Mechanically, lower prices mean the same automatic contribution buys more shares, which is the quiet advantage of a schedule that keeps running through a decline. What a crash is not is a reason to redirect money you may need soon into stocks, or to borrow your way into the dip. The soundest version of buying the dip is simply refusing to interrupt the buying you had already planned.
Where should the money I need soon be during a crash?
Outside the stock market entirely, before any crash begins. Money with a date in the next few years, rent, tuition, a down payment, belongs in savings, where a bad quarter cannot touch it. The cushion is what buys your investments the freedom to fall without forcing a sale. If a crash finds soon-needed money in stocks, that is the plan needing repair, not the market.
Keep reading
Everything here is education, not financial advice. How I source numbers and handle corrections: Editorial standards. The full risk language: Disclaimer.