Module 2 · Learn Trading
Candlesticks
How to read the market's handwriting.
A candlestick is the market's handwriting. One candle compresses an entire period of trading, a minute, an hour, a day, into four facts and a shape, and once you can read the shape, every chart on every platform in every market becomes legible. This is the alphabet; everything in later modules is spelled with it.
The anatomy: four prices, one shape
Each candle records where the period opened, the highest price traded, the lowest price traded, and where it closed. The thick part, the body, spans open to close. The thin lines, the wicks, reach to the extremes. On this site, a candle that closed higher than it opened is drawn hollow; a candle that closed lower is filled ink. Shape carries the meaning; color is just each platform's costume.
Reading the shape: a tug-of-war record
Every candle is the minutes of a meeting between buyers and sellers. A long body says one side dominated from open to close. A long wick says one side tried to push price somewhere and got rejected: the market visited that level and refused to stay. Small body with long wicks on both ends says the meeting ended in a stalemate. Once you read candles as behavior instead of decoration, the named patterns become obvious instead of memorized.
The patterns that matter, by outcome
Bullish reversals (sellers tried, buyers won)
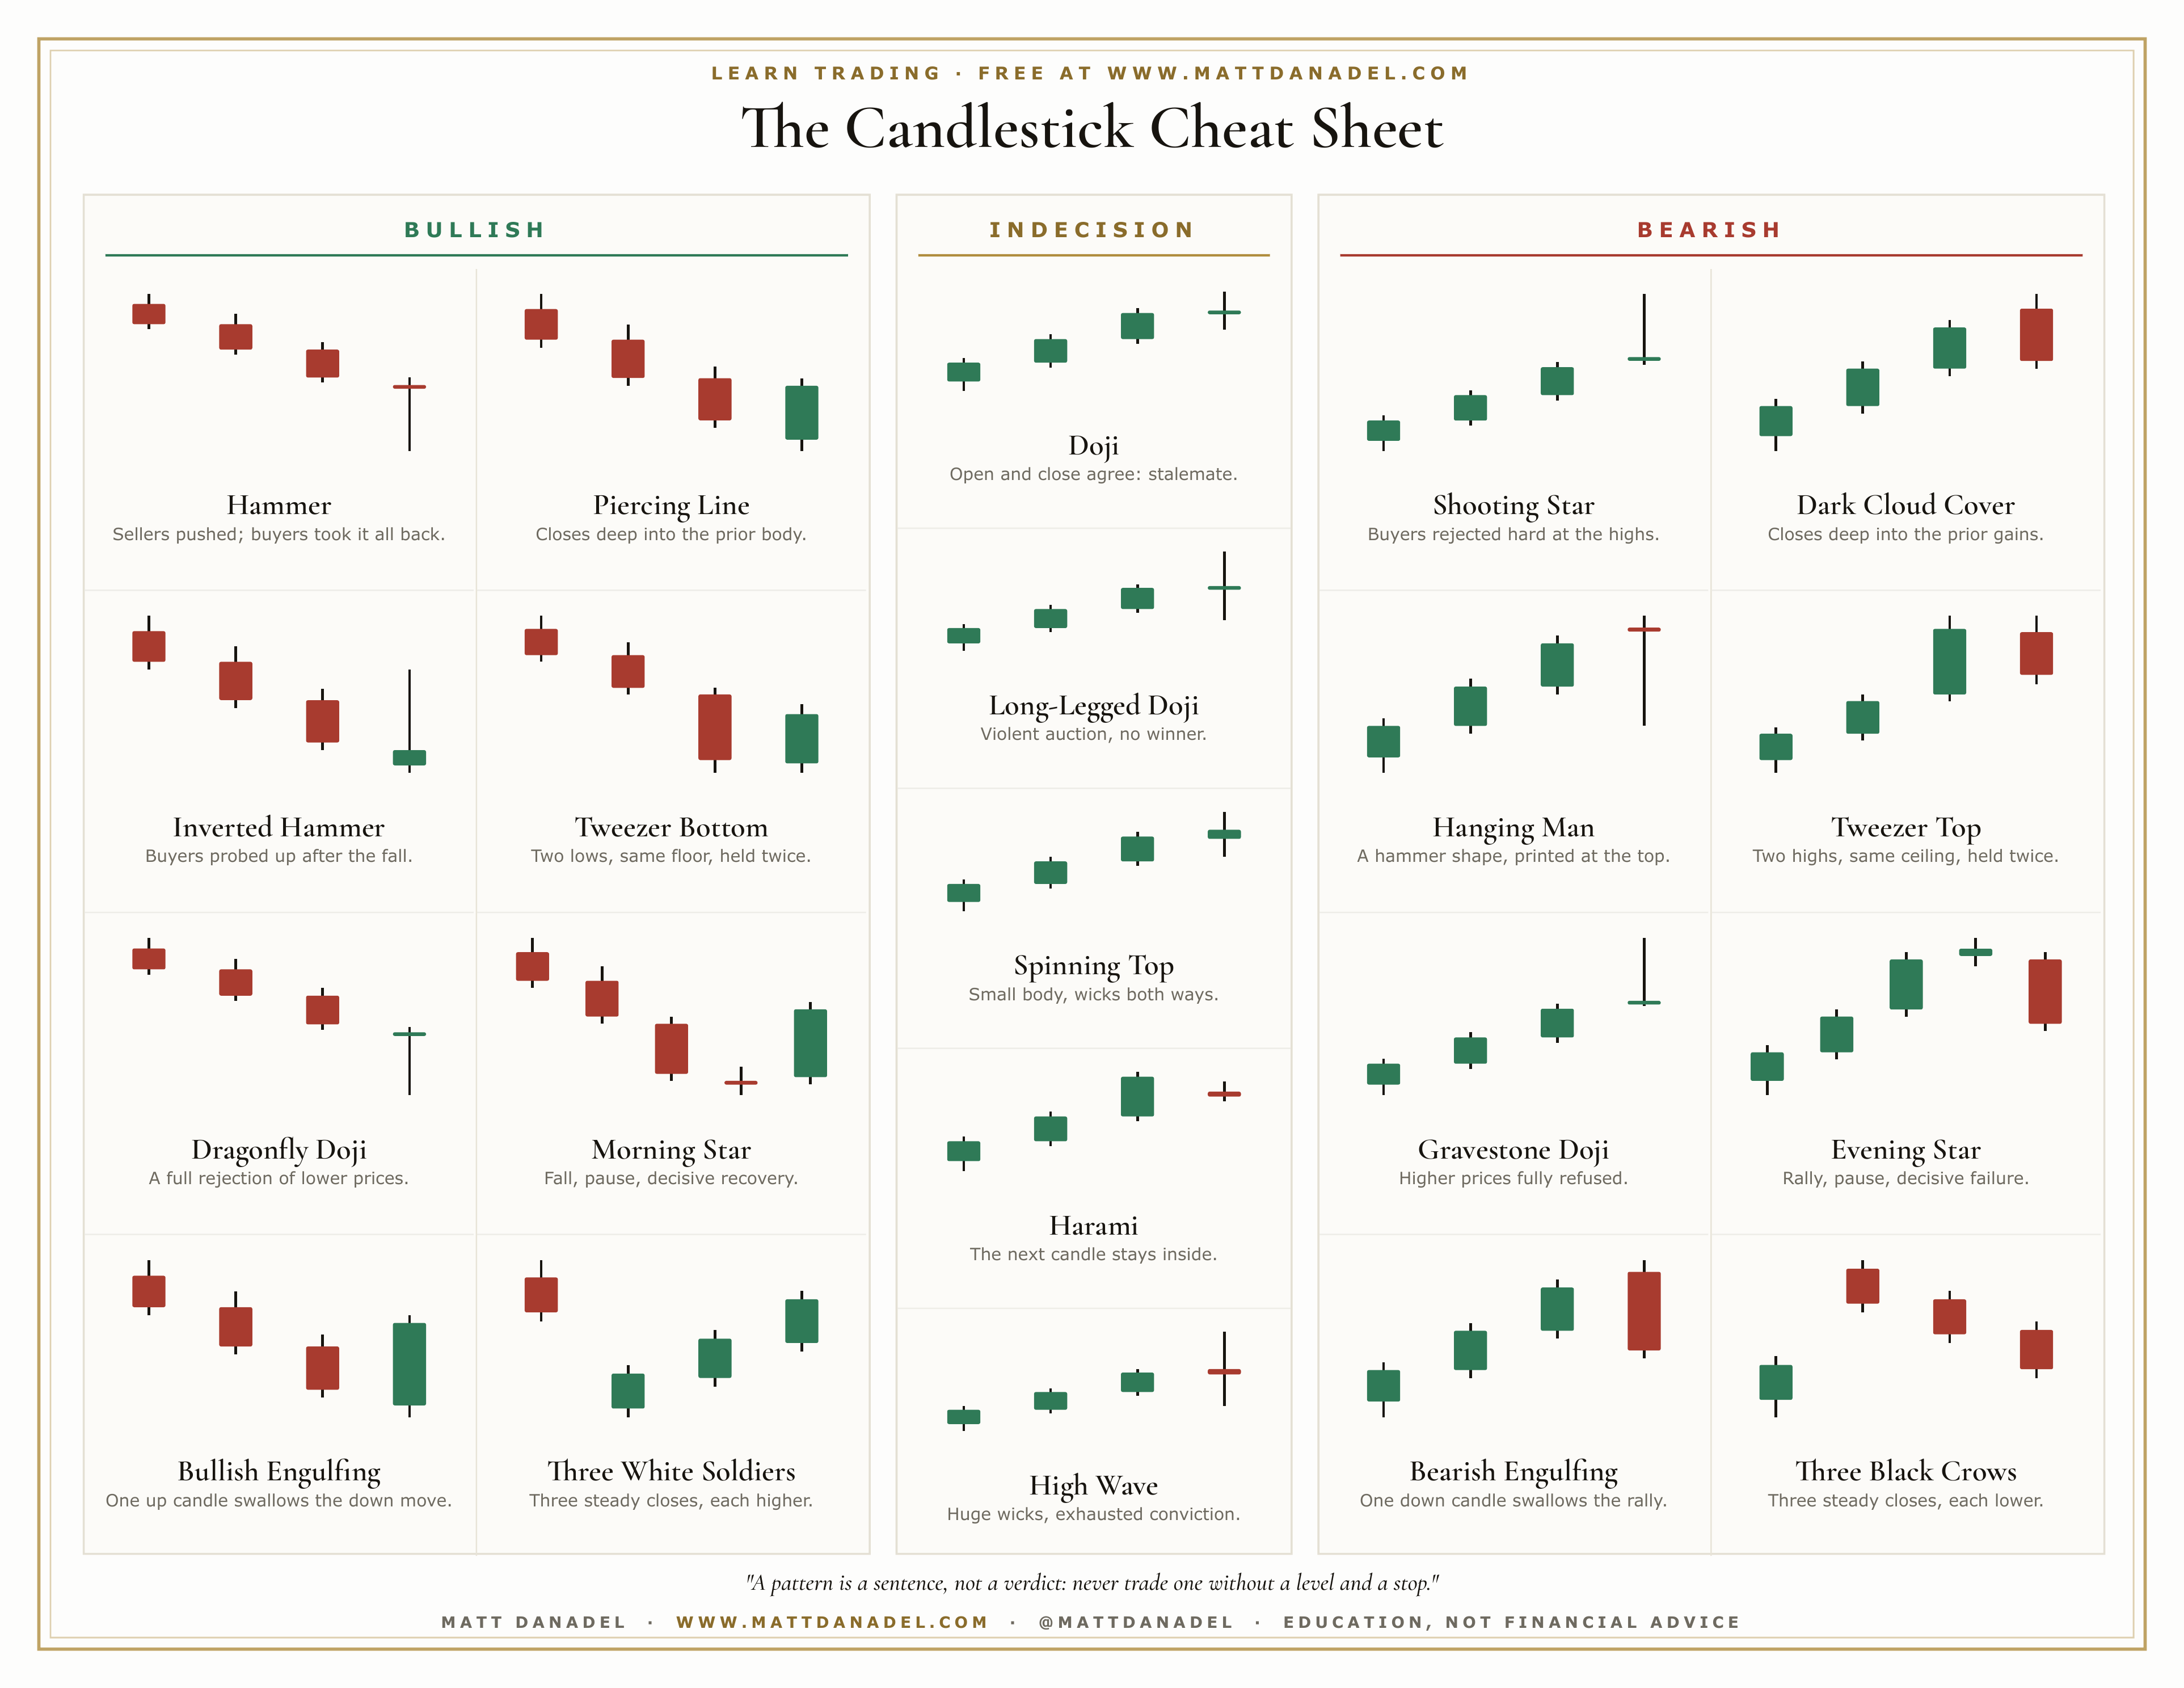
The hammer: a long lower wick and a small body near the top, printed after a decline. Sellers pushed price down hard; buyers bought all of it back. The bullish engulfing: a down candle followed by an up candle whose body swallows it whole, a changing of the guard in two bars. The morning star: decline, pause, decisive up candle, a three-act reversal. Cousins like the inverted hammer, piercing line, and tweezer bottom tell the same story with different punctuation.
Hammer
Bullish Engulfing
Morning Star
Indecision (nobody won)
The doji, where open and close land almost on top of each other, and the spinning top, a small body with wicks both ways, mean the auction ended unresolved. After a long trend, indecision is information: the side that was winning failed to win that period. In the middle of chop, it's just more chop.
Doji
Spinning Top
Harami
Bearish reversals (buyers tried, sellers won)
The shooting star mirrors the hammer: a long upper wick after an advance, buyers rejected at the highs. Thebearish engulfing, evening star,hanging man, and dark cloud cover are the bearish twins of the bullish set. Symmetry is the point: the grammar is identical, only the direction flips.
Shooting Star
Bearish Engulfing
Evening Star
Context decides everything
Here is what separates people who read candles from people who memorize them: the same shape means different things in different places. A reversal pattern needs something to reverse, a trend into it, and somewhere meaningful to happen, a level the market has respected before. That's why the next two modules, support and resistance and chart patterns, are where candlestick reading starts paying rent. Learn the alphabet here, then learn where the words matter.
The Candlestick Cheat Sheet
Where the ebook goes deeper
Part IV of The Complete Trader teaches chart reading as one honest system: candlesticks, the levels that give them meaning, and the discipline of acting only when shape, level, and size agree, with every example worked and sized.
Questions, answered straight
What do the colors on candles mean?+
Convention only. Most platforms draw a candle that closed above its open in green or white, and one that closed below its open in red or black. This site draws up-candles hollow and down-candles filled in ink, which means the same thing and prints cleanly. The information is in the shape, not the color.
What timeframe should candlesticks be read on?+
Every timeframe draws them the same way; a daily candle just summarizes more trading than a five-minute candle. Patterns on longer timeframes summarize more decisions and are generally taken more seriously. The reading skill transfers unchanged.
Do candlestick patterns actually work?+
They describe real crowd behavior at real moments, which is why they've survived since rice traders in Japan used them centuries ago. But no pattern is a promise. A pattern at a meaningful level with a sized position and a stop is a trade idea; a pattern floating alone in the middle of nowhere is trivia.